
 What's LaSIE?
 |
News |
 Research Topics
 |
People |
 Publications
 |
Seminars |
 Member's Area
 | |
|
Laboratory for Scientific Instrumentation and Engineering
|
|
|
|
|
||||||||
| Research topics in LaSIE | » Back to Research page |
|
Tip enhanced near-field CARS microscopy for molecular nano-imaging | |
|
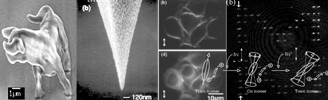
Introduction Light microscopy having a nanometric spatial resolution is a desirable technique for the advances of nanoscience, which provides rich information on molecular species and structures. To attain this attractive tool, we have to break the barrier of spatial resolution due to the diffraction of light wave (= diffraction limit). There are two ways to achieve a super resolution beyond the diffraction limit, near-field optics and nonlinear optics. In this current research, we combine these two techniques in order to make a breakthrough of spatial resolution and small signal sensing. For imaging of molecular vibration, coherent anti-Stokes Raman scattering (CARS) [1], one of nonlinear Raman scattering, is employed. We have realized near-field CARS imaging of DNA molecules. Tip-enhanced CARS microscopy The apertureless type of near field scanning optical microscopy (NSOM) uses a metallic probe with a dimension much smaller than the wavelength of light. The probe tip strongly enhances the optical field at its apex through the excitation of local surface plasmon polaritons. We used this enhancement effect for local amplification of the nonlinear Raman scattering, CARS, in this research [2-5]. The CARS process uses three incident fields including a pump field (ω1), a Stokes field (ω2; ω2 < ω1), and a probe field (ω1), and induces a nonlinear polarization at the frequency of ωCARS = 2ω1-ω2, as shown in Fig. 1(a). When the frequency difference of ω1 and ω2 (ω1-ω2) coincides with one of specific molecular vibrational frequency (Ω) of a Raman-active mode of a given sample, the anti-Stokes Raman signal is resonantly generated. When the CARS polarization is induced by the tip-enhanced field, the spatial resolution is essentially determined by the size of the tip (Fig. 1(b)). In addition to the tip effect, owing to the third-order nonlinearity of the CARS process, the excitation of CARS polarization can be tightly confined and strongly enhanced at the very end of the tip. The tip-enhanced CARS microscope that we developed consists of two mode-locked Ti:sapphire lasers, inverted microscope, and an atomic force microscope (AFM) equipped with a silver-coated cantilever, as shown in Fig. 2 [3-5]. The laser beams are collinearly focused on the sample surface by an objective lens (NA = 1.4), and the probe tip is contacted on the focal spot. The CARS signals generated near the tip are collected with the same objective lens and detected with a photon-counting avalanche photodiode. Tip enhanced CARS imaging of DNA molecules Recently we have realized CARS imaging of a specific vibrational mode of DNA molecules in the fingerprint region [5]. DNA network structure (poly(dA-dT).poly(dA-dT)) was used as a sample, which consists of DNA double-helix containing adenine and thymine bases besides the polynucleotide chain. The network structure was visualized at a vibrational frequency (~1337 cm-1) corresponding to the ring-breathing mode of diazole in the adenines, as shown in Fig. 3(a). The DNA structures could not be visualized at an off-resonant frequency (~1278 cm-1) in Fig. 3(b), which verifies the resonant generation of the plasmon-enhanced CARS signals. Figure 3(c) shows a line profile of a row indicated by the solid arrows in Fig. 3(a). The FWHM (full-width of half-maximum) of the narrower peak at x ~ 700 nm is found to be ~15 nm. Thus, our plasmonic CARS microscope has achieved molecular-vibration imaging with a spatial resolution of ~15 nm and sufficient sensitivity. References
» Back to Research page |
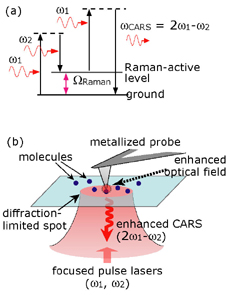 Fig.1 a) Energy diagram of the CARS process. b) Schematic illustration of the local enhancement of CARS by a metallic tip. 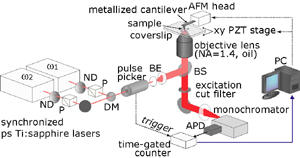 Fig.2 The exprimental setup of Tip enhanced near-field CARS microscopy 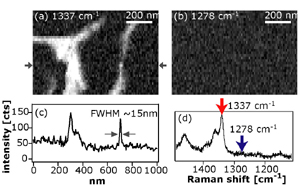 Fig. 3 Tip enhanced CARS image of DNA network structures a) at the on-resonant frequency (1337cm-1) and b) at the off-resonant frequency (1278cm-1). c) Line profile of a row indicated by the arrows in a). d) Raman spectrum of the DNA network. |