
 What's LaSIE?
 |
News |
 Research Topics
 |
People |
 Publications
 |
Seminars |
 Member's Area
 | |
|
Laboratory for Scientific Instrumentation and Engineering
|
|
|
|
|
||||||||
| Research topics in LaSIE | » Back to Research page |
|
Infrared near-field scanning microscopy using tunable laser and apertured cantilever | |
|
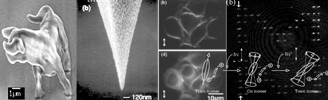
Introduction Because the light having the wavelength of infrared (IR) region resonants with molecular vibrations, IR light can be used for identification of molecular species and moieties, and also for studying molecular structures. We developed IR near-field scanning optical microscopy (IR-NSOM), using originally developed apertured cantilever and IR source that can be tuned from wavelength of 2.9µm to 6.7µm. The apertured cantilever localizes the IR light in a very small space below the diffraction limit of light, which enables one to investigate molecular state in a microscopic region. The spatial resolution of the conventional IR spectroscopy such as Fourier transform Infrared spectroscopy (FTIR) has been limited to several tens of micrometer because of the long wavelength. Apertured cantilever brings super resolution Apertured probe was fabricated by photolithography and Si anisotoropic etching [Fig. 1(a)]. An aperture of submicron in diameter was drilled off at the tip end by a focused ion beam (FIB) processing [Fig. 1(b)]. Because of the wide horn angle at the tip end, this probe offers much higher optical throughput than that of the tapered fiber probes commonly used for IR-NSOM experiments. Also the hollow structure of the tip enables the use of the probe throughout the whole mid-infrared region. The IR absorption of glass materials has limited the use of fiber probe to a narrow spectral range. The optical system of IR-NSOM IR light was generated by mixing the signal and idler beams from the optical parametric amplifier (OPA) in a AgGaS2 crystal [difference frequency generation (DFG)]. By adjusting the optical parametric conditions, the wavelength of IR light can be tuned from 2.9µm to 6.7µm, covering the wide spectral range required for IR spectroscopy. The IR beam is guided to the microscope and focused onto the sample surface through a Cassegrain objective (NA 0.58, 15X) (Fig. 2). At the focal spot of the IR light, the apertured cantilever was precisely positioned. The transmitted light through the sample was collected by another Cassegrain objective and detected by a liquid nitrogen cooled mercury cadmium telluride (MTC) detector. IR absorption image was obtained by scanning the sample stage in x-y direction with the tip-sample distance kept to be constant. Near-field imaging of molecular changes in cholesteryl oleate Cholesteryl oleate (Fig. 3) is one of the causative agent of arteriosclerosis. Recently, it was shown that high power IR laser can cause dissociation of the ester bond in a cholesteryl oleate molecule and remove them selectively. We observed cholesteryl oleate thin film by the developed IR-NSOM, and identified the region where the molecular had changed by IR irradiation. Dissociation of cholesteryl oleate was performed by the free electron laser at Science University of Tokyo (FEL-SUT). The wavelength was tuned to 5.75µm, highly absorbed by ester bonds in cholesteryl oleate. The optical micrograph of cholesteryl oleate thin film after FEL irradiation is shown in Fig. 4. The irradiated area is depicted by the black solid line. The near-field infrared image in the white dashed line is shown in Fig. 6 (wavelength 5.75µm, scan area 25µm x 25µm). High transmittance region at the both sides of the image and low transmittance region at the center region is clearly distinguished with contrast of 38%. Also the edge response between the irradiated area and non-irradiated area was estimated to be less than 2.5µm, which shows a high spatial resolution beyond the diffraction limit of the illumination light. References » Back to Research page |
 Fig.1. a) Scanning electron micrograph of the apertured cantilever. b) Detailed view of the tip apex.  Fig.2 Optical setup of IR-NSOM.  Fig.3 a) Molecular structure of cholesteryl oleate. b) Optical micrograph of cholesteryl oleate after FEL irradiation. The black line represents irradiated area.  Fig.4 IR-NSOM image of cholesteryl oleate. Wavelength was tuned at 5.75 µm. Scanned area is 25 µm x 25 µm. |