
 What's LaSIE?
 |
News |
 Research Topics
 |
People |
 Publications
 |
Seminars |
 Member's Area
 | |
|
Laboratory for Scientific Instrumentation and Engineering
|
|
|
|
|
||||||||
| Research topics in LaSIE | » Back to Research page |
|
Tip-Enhanced Near Field Raman Spectroscopy for Nano-Observation and Nano-Analysis of Molecules | |
|
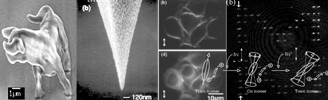
Near field Raman spectroscopy using a metallic tip Photons are confined at an apex of a metallic tip due to coupling with localized surface plasmon polaritons. Confining dimensions of photons correspond to a radius of the tip apex, as shown in Figure 1. By using the metallic tip having a nanometer-scale apex in place of the objective lens, we can probe optical properties of matters at nanometric scale, then we are released from the barrier of wavelength of photons (diffraction limit). We proposed tip-enhanced near filed microscopy using such a metallic tip that enhances electric field locally and strongly at its apex [1, 2]. The local-field-enhancement amplifies effective cross section of Raman scattering by a factor of 2000 or more. Combination of the tip-enhanced near field microscopy with Raman spectroscopy provides us a new tool for nano-scale observation and analysis of a variety of materials such as organic molecules, DNA nano-crystals and carbon nanotubes [3-7]. Chemical interaction of a metallic tip with organic molecule [5] Fig. 2 shows the Raman spectral mapping of Rhodamine 6G molecules excited at the silver-coated AFM tip with an interval of 30nm. In colored spectra, some peaks are slightly shifted and their relative intensities are quite different from those of the other spectra. Some additional peaks, which have never been observed in the other spectra appear. Shift of the vibrational peaks and revealing of new vibrational peaks are observed due to chemical interaction of the tip with the adsorbate molecules. Near field Raman spectroscopy of adenine nano-crystal [7] Fig. 3 (a) shows the detected Raman spectrum of adenine nano-crystal. Height of the nano-crystal is 7 nm and width is 30 nm. A quite few number of spectral lines are observed, as marked by arrows, when the probe tip is near enough to the sample. These lines except the one at 924 cm-1 are assigned as the vibrational modes, inherent to adenine molecule, according to the molecular orbital calculation. For examples, two majors lines, one at 739 cm-1 and the other 1328 cm-1 are the ring breathing mode and combination of C-N stretching mode and C-C stretching mode, respectively (Fig. 3 (c)). The enhancement factor for the ring breathing mode is estimated to be 2700. Determination of diameter and chirality of a carbon nanotube [7] Fig. 4 (a) shows near field Raman spectrum of a carbon nanotube (CNT) when the metallic tip was placed on the CNT. Typical Raman band of a CNT, i.e. G-band, was observed at 1592 cm-1 and 1573 cm-1. On the other hands, only a weak peak of G-band was observed in spectrum (b) obtained without the metallic tip which is coincident with conventional micro-Raman spectrum. The results shows that tip-enhanced field amplified locally Raman scattering of the CNT to the extent of detectable level. Furthermore, judging from the spectral structure of G-band in spectrum (a), the CNT is supposed to be semiconductor. We also measured near field Raman band of the radial-breathing-mode of the CNT at 165 cm-1 in spectrum (c). A diameter of the CNT is determined from the peak position of the band which is in inverse proportion to it. Finally, we deduced a chiral vector of the CNT from the relation between the diameter and the energy band of the CNT. Reference
» Back to Research page |
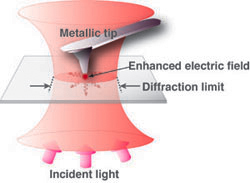 Fig.1 Tip-enhanced electric field generated by a metallic tip. 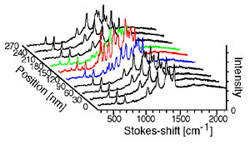 Fig.2 1D Raman spectral mapping of Rhodamine 6G molecules. 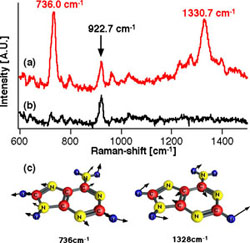 Fig.3 (a)Near field Raman and (b)far-field Raman spectra of adenine nano-crystals. (c) Assingned vibrational modes at 736 cm-1 and 1330 cm-1. 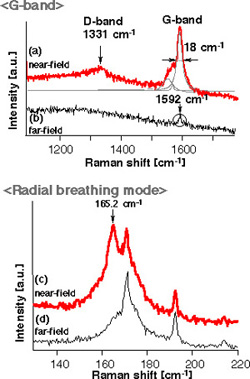 Fig.4 Raman spectra of G-band ((a) near field, (b)far-field) and radial breathing mode ((c) near field, (d)far-field). |