
 What's LaSIE?
 |
News |
 Research Topics
 |
People |
 Publications
 |
Seminars |
 Member's Area
 | |
|
Laboratory for Scientific Instrumentation and Engineering
|
|
|
|
|
||||||||
| Research topics in LaSIE | » Back to Research page |
|
Multifocus second-harmonic generation microscopy for live cell/tissue observation | |
|
Introduction A second harmonic generation (SHG) microscope is expected to be a useful tool for observing biological cell activities with its unique imaging properties. Since SHG is a second order nonlinear optical effect, the SHG microscope has the imaging properties common to those in a two-photon fluorescence microscope, such as high spatial resolution in three dimensions and low phototoxicity. In addition, the microscope can image highly ordered structural proteins selectively, and also be used to image membrane potential with potential sensitive dyes. In this research, we developed a multifocus SHG microscope, where the image acquisition rate and the SHG detection efficiency are improved. With the developed microscope, scanning speed of a specimen can be increased up to 3ms / frame, which enables us to observe cell activities changing in a small time-scale. Multifocus SHG microscopy A mode-locked Ti:Sapphire laser (900nm, 82MHz, 80fs) was used as a light source. We introduced the laser beam into a microlens array disk to divide the beam to several tens of beamlets (Fig.1). Each laser beam was introduced into an objective lens to generate multiple foci in a specimen. SHG signal from each focus was collected by another objective lens which was placed below the specimen, and transmitted to an intensified CCD camera. The laser transmitted through the specimen was removed by an interference filter placed between the second objective lens and the intensified CCD camera. The rotation of the microlens array scans the specimen with the multiple foci and produce a SHG image on the camera. In our experiments, 1800rpm rotation of the disk provided a SHG image every 3ms (12 images / rotation) and the images were acquired by the CCD camera at 30 images / second. The diameter and NA of the microlenses were 250 µm and 0.0125, respectively. Real-time SH imaging To demonstrate the scanning speed of the microscope, we have imaged the periodical contraction of a cultured cardiomyocyte of a rat. The cells were isolated from rats one day after the birth and cultured in DMEM. RH237 was used to label the plasma-membranes. Fig. 2 shows a time series of SH images of the cardiomyocyte given by the developed microscope. The time separation between neighboring images in Fig. 2 is 33 ms. Contraction of the cell accompanied by a change in intensity of SHG was observed. For example, a part of the membrane shown by the dashed arrow moved into the solid arrow after 132 ms. Increase of SHG intensity at the position indicated by the circle was also observed. Comparison vs. fluorescence Fig. 3 shows fluorescence and SH images of living HeLa cells stained with RH237. Since RH237 give both strong SH and fluorescence emission, this sample can be used for the comparison of the imaging properties between SHG microscopy and fluorescence microscopy. In Fig.3, fluorescence images show the distribution of the fluorescent molecules at the cell membrane and also at the cytoplasma. However, in SH images, SH signal is given strongly at the cell membrane and the signal from the cytoplasma is suppressed. This is because the molecular orientation in the cell membrane is well ordered and, on the other hand, the molecules at the cytoplasma show random orientation without noncetrosymmetric structure which is required for SHG. Reference
» Back to Research page |
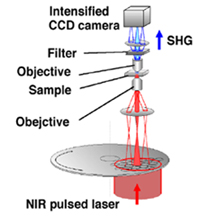 Fig.1 A multifocus laser scanning system for second-harmonic generation (SHG) microscopy. 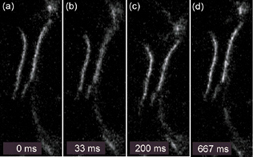 Fig.2 Real-time SHG images of a living rat cardiomyocyte stained with RH237. 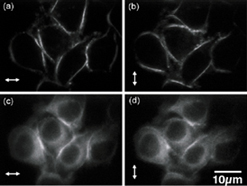 Fig.3 Comparisons between two-photon fluorescence and SHG images. a) and b) show fluorescence images, and c) and d) show second-harmonic images of cultured HeLa cells. The arrows indicate the direction of polarization of incident laser. |